

China's Energy Transition Part 1

In most recent IEA study, it projected that China’s CO2 to decline starting this year despite seeing robust growth in electricity generation between 2023 to 2026 (half of the overall global growth)
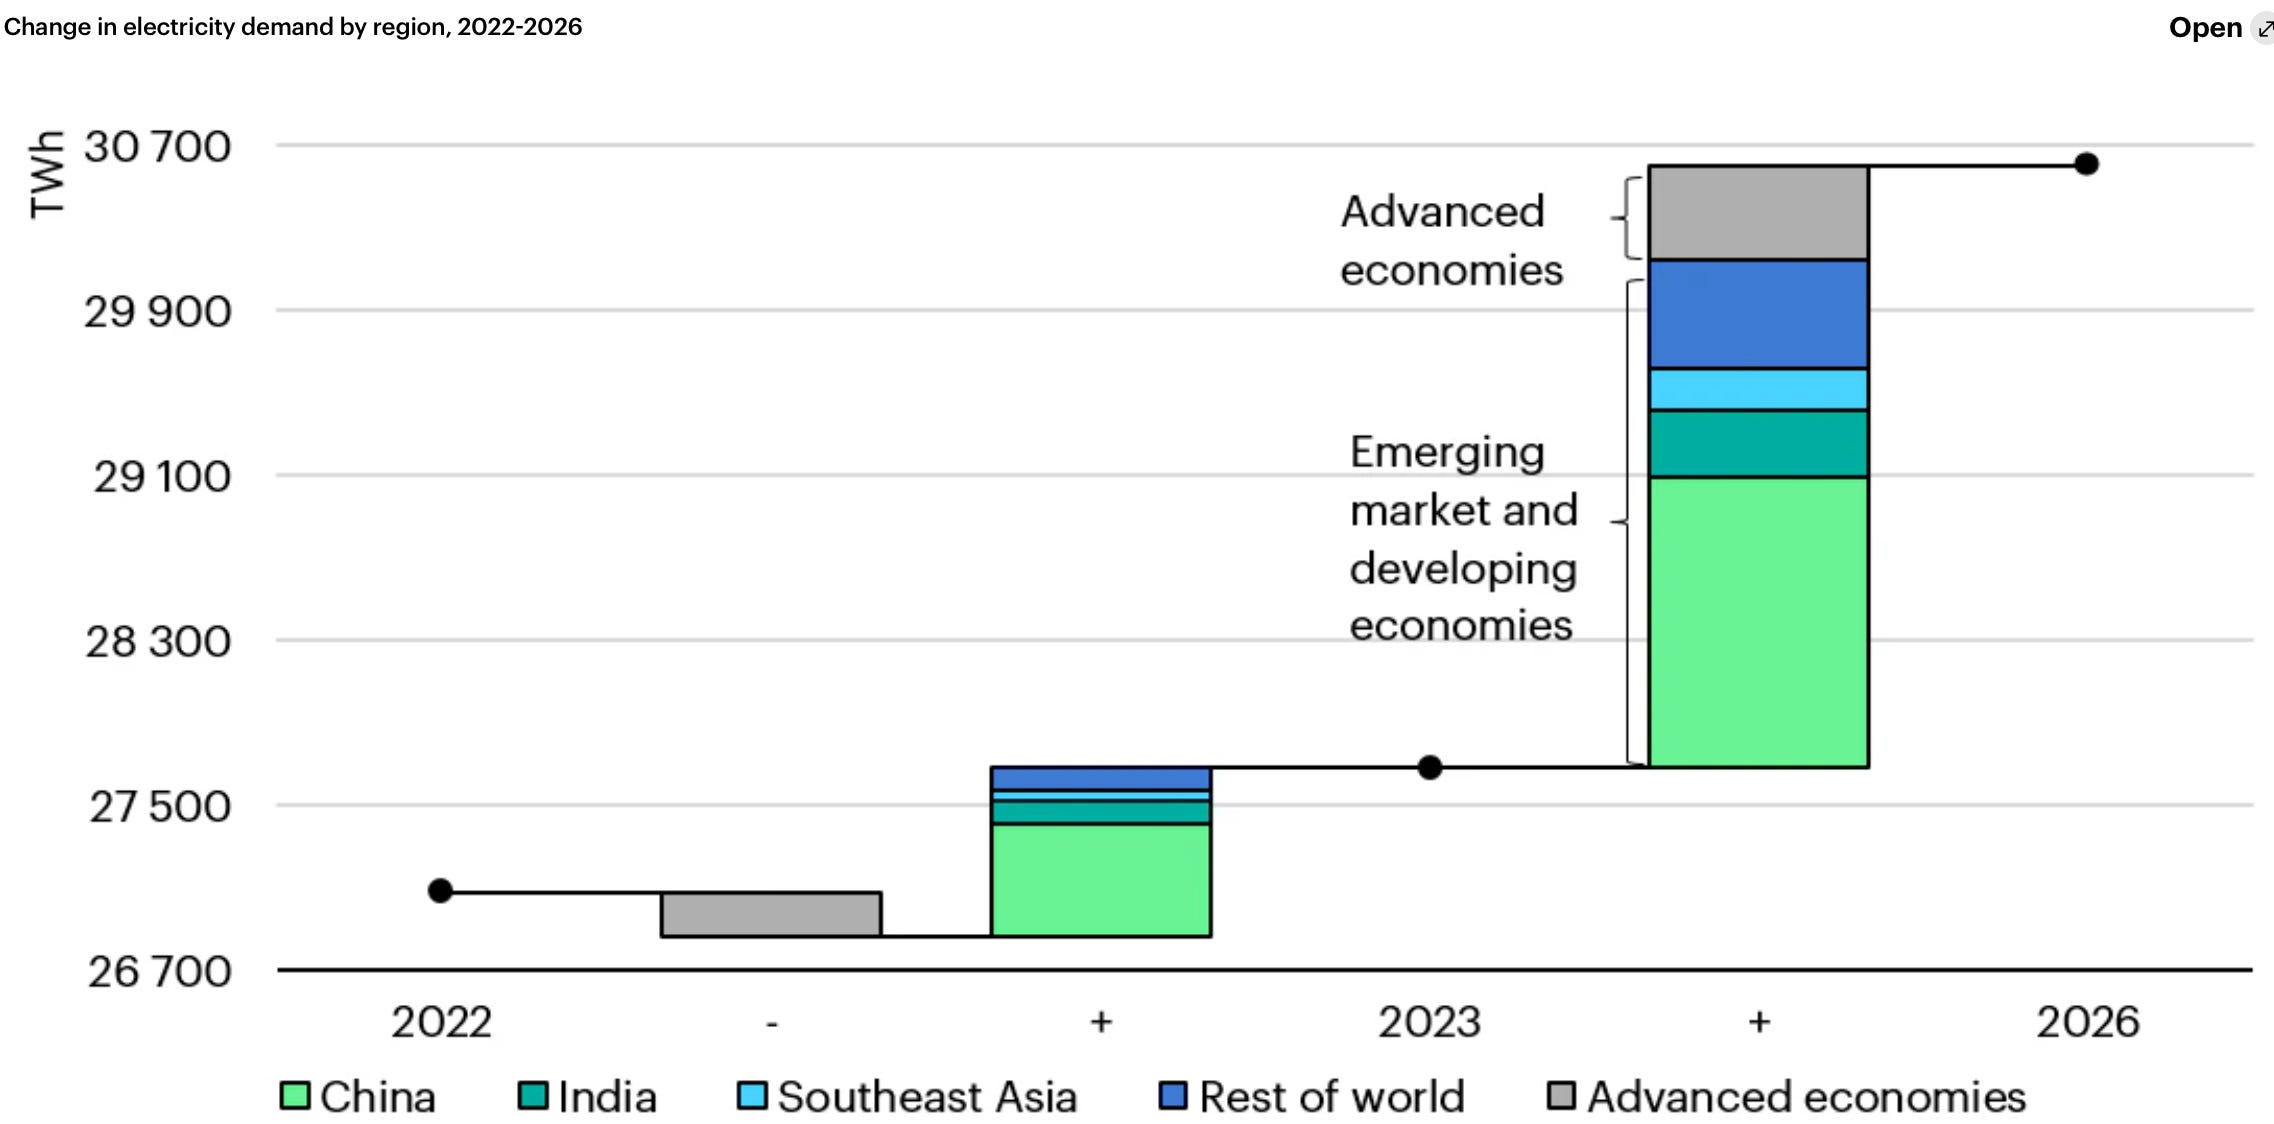
This is natural outcome of aggressively adding renewable capacity in past few years (especially 2nd half of 2023)
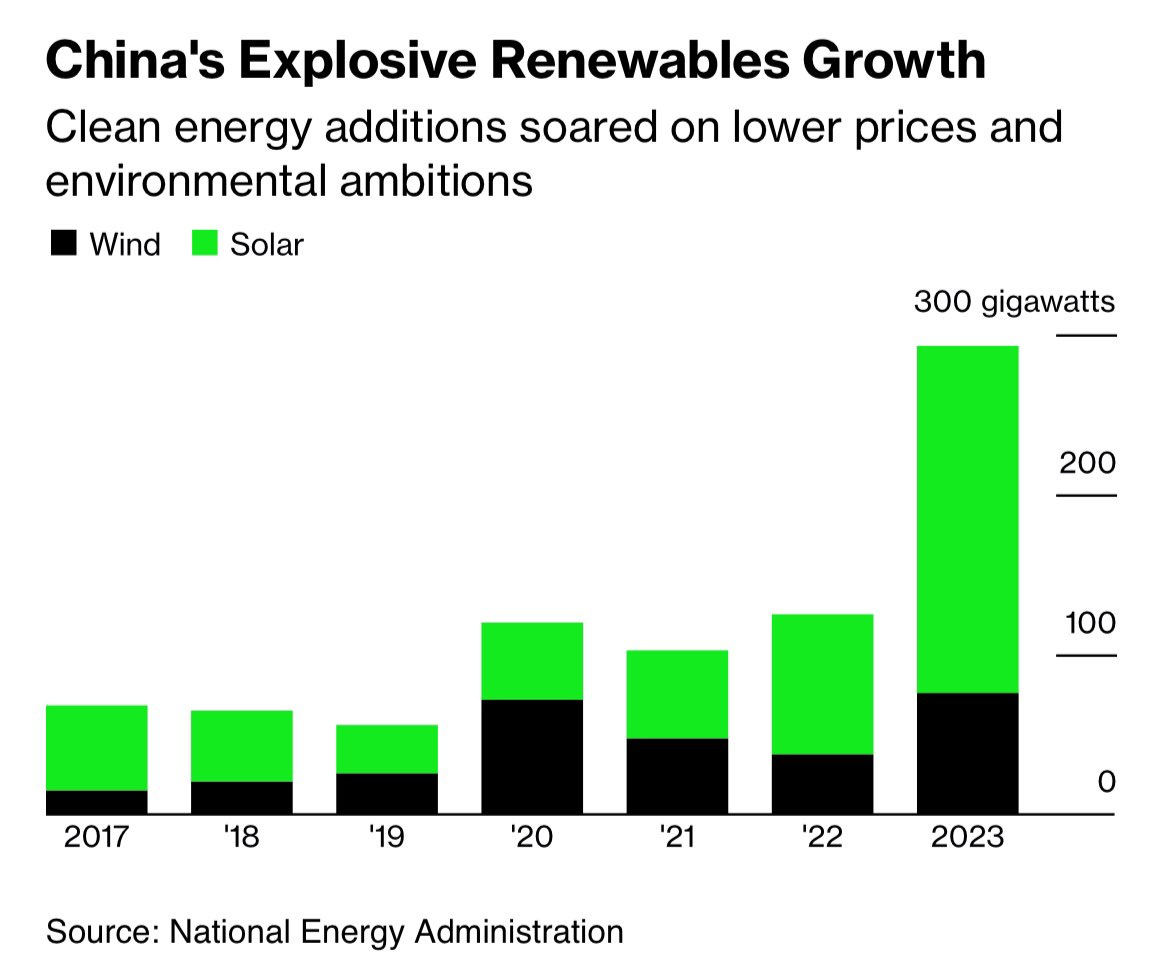
China’s strategy of building large renewable bases paired with thermal plants (for backup), ESS (for handling daily variations) and UHV cable (for long range transmission) is starting to work. I expect huge growth in wind/solar power generation this year, since that’s when much of 2023 additions come online fully.
China Wind Energy Association (CWEA) recently announced 809 TWh of electricity was generated from Wind last year (almost as much as EU & US combined, accounting for 10% of total power mix)

More importantly, Wind energy cost lowered even further to 0.15 RMB/KWh, while employ 2 million people (directly or indirectly) and achieving 1.2 Trillion RMB of value. It’s also important to note that we are not close to fully explore wind potential in China. CWEA estimates 6.14TW of onshore wind and 2.78TW of offshore wind resources can be explored (this may improve even further in the future when technology improves)
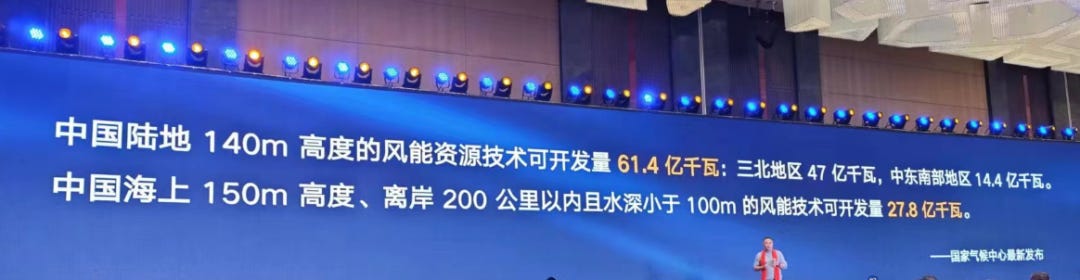
China had 2.56TW of total installed power in 2022 running at 40% utilization, so Wind alone can fully replace energy deal.
Their solar progress is even more impressive and the potential is endless. Wang Chuanfu once said China has enough solar potential to power China 100 times over (or something like that). A recent study showed that China’s reservoir alone could install 862GW of floating PVs and generate 1425.8TWh of electricity per year. A good portion of solar installation this year was distributed roof top installations rather than large solar projects. While solar utilization is extremely poor, the increased adoption of ESS and SiC power chips will continue to improve smart grid’s ability to handle peak/trough in energy demand and energy generation. As I discussed previously, SiC industry is blossoming in China and there will be enough capacity for both NEVs and electricity grid/power generation.
Solar industry in China has entered the fiercest of competitions. For example, Longi along is pushing 190GW in solar wafer capacity
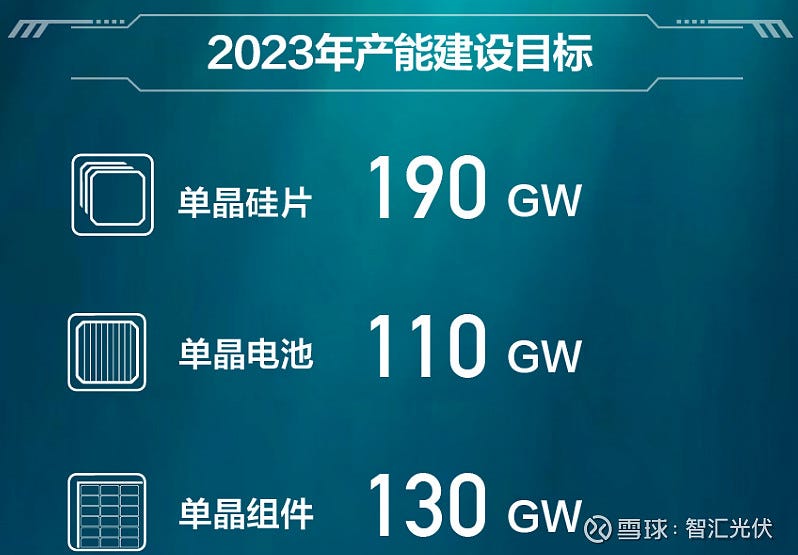
If we add in Trina, JA Solar, Jinko and others, it’s hard to imagine the amount of PVs that Chinese solar industry is already able to produce.
Due to this influx of wind and solar capacity, China will see CO2 emissions from electricity go down even as NEV usage, industrial growth and heat pumps really push up electricity usage over the next few years.
As battery and pumped hydro ESS continue to increase, an ever smarter grid will increasingly be able to store up excessive renewable industry and use them when they are actually needed.
So, how do we deal with seasonal variations and other aspects of decarbonization like industrial usage, marine and aviation fuel? I will cover that next.
Can you recommend any stats which can show how growth curve in transmission capacity is developing?